
RevenueJump Local Search Analysis™
Search Result Pages
Local Listings
Local Reviews
Do reviews affect local search rankings?
Welcome to RevenueJump’s new and improved Local Search Analysis™ (check out the previous analysis here). We’ve upped the ante this time by making the following improvements:
- We bumped up the number of keywords (29 to 41) and cities (107 to 146) we analyzed.
- Rather than just the top 6 results, we looked at the top 10 to give us a wider source of data.
- OUR FAVORITE: We not only counted reviews, but we also captured ratings to see how they affect rankings.
Have any questions or suggestions? Please, let us know. In the meantime, enjoy our 2017 Local Search Analysis™!
Our Methodology
We focused our analysis on Google’s local search results because it’s the most-used search engine.
We captured the quantity and rating of reviews for each top-10 listing across 41 unique keywords and 146 U.S. cities.
Our statistical analysis is based on captured data for more than 1.3 million local reviews.
Overall Findings
Quantity + Rating = Ranking
Review quantity AND ratings affect a local listing’s ranking in Google’s local search results.
Isn’t the linear digression of each statistic amazing? With data stretching over 54,376 business listings, this is a strong correlation.
Do reviews help your ranking? Absolutely.
Quantity
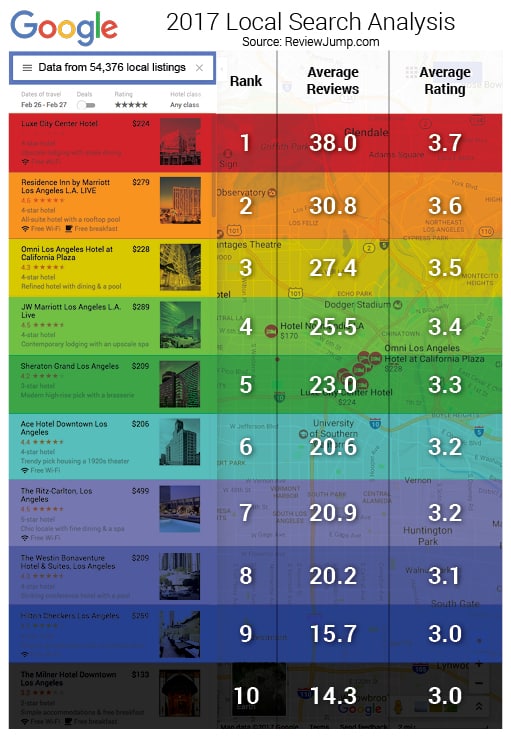
Our analysis shows the highest-ranked listings on Google’s local search results have an average of 38 reviews. On the other hand, the lowest ranked listings have an average of only 14.3 reviews.
Rating
The top-ranked listings on Google’s local search results have an average rating of 3.7-stars, while the tenth-ranked listings have just 3.0-stars.
Keyword-by-Keyword Findings
In all, our research encompassed over 1.3 million reviews. This analysis included a total of 41 keywords, a dozen more than our last analysis. Here is how that data shakes out on a keyword-by-keyword basis.
Reviews and Ratings per Listing
Here is a table of each keyword from our analysis, including the number of reviews per listing and the average rating for each keyword.
Keyword |
Reviews |
Rating |
| Accountant | 2.0 | 1.8☆ |
| Attorney | 12.6 | 3.1☆ |
| Auto Repair | 25.5 | 4.2☆ |
| Bank | 3.9 | 2.9☆ |
| Car Dealer | 151.0 | 3.9☆ |
| Car Wash | 21.9 | 3.4☆ |
| Carpet Cleaner | 14.2 | 3.4☆ |
| Chiropractor | 15.3 | 4.2☆ |
| Day Care | 5.2 | 3.0☆ |
| Day Spa | 16.2 | 3.9☆ |
| Dentist | 33.9 | 4.2☆ |
| Dry Cleaner | 5.4 | 3.0☆ |
| Family Doctor | 5.4 | 2.5☆ |
| Hair Salon | 18.5 | 4.0☆ |
Keyword |
Reviews |
Rating |
| Home Remodeler | 4.6 | 2.5☆ |
| Hotel | 115.8 | 2.7☆ |
| House Cleaning | 8.0 | 2.8☆ |
| HVAC | 3.09 | 3.6☆ |
| Insurance Agent | 5.2 | 2.9☆ |
| Jeweler | 13.6 | 3.7☆ |
| Landscaper | 4.0 | 2.5☆ |
| Lawyer | 12.2 | 3.2☆ |
| Locksmith | 21.3 | 3.7☆ |
| Mortgage Lender | 6.8 | 2.2☆ |
| Moving Company | 21.0 | 3.5☆ |
| Nutrition Store | 5.3 | 3.2☆ |
| Optometrist | 12.8 | 3.6☆ |
| Orthodontist | 23.9 | 4.0☆ |
Keyword |
Reviews |
Rating |
| Pediatric Dentist | 21.9 | 3.8☆ |
| Pest Control | 11.0 | 2.8☆ |
| Photographer | 8.0 | 3.3☆ |
| Physical Therapist | 3.4 | 2.4☆ |
| Plastic Surgeon | 10.7 | 3.2☆ |
| Plumber | 32.4 | 3.5☆ |
| Real Estate Agent | 5.1 | 2.6☆ |
| Restaurant | 126.7 | 4.3☆ |
| Roofer | 8.7 | 3.0☆ |
| RV Dealer | 23.0 | 3.4☆ |
| Sewing Store | 11.0 | 3.5☆ |
| Tattoo Shop | 26.2 | 4.4☆ |
| Veterinarian | 27.5 | 4.2☆ |
Reviews per Keyword
This pie chart shows the number of reviews for each keyword in our analysis.
City-by-City Findings
Our 2017 study included a total of 142 cities, 33% more than last time. Here are a few tables that dissect our data on a city-by-city basis.
Ratings by City
Here we show which cities are the most negative or positive for the reviews they have on Google, while comparing the sentiment of smaller versus larger cities.
- Smaller Cities
- Larger Cities
Reviews per 1,000 People
Least Reviews |
Most Reviews |
| 1. Los Angeles, CA: 4.5 | 1. Novi, MI: 180.5 |
| 2. Philadelphia, PA: 7.1 | 2. Orem, UT: 175.4 |
| 3. San Jose, CA: 10.0 | 3. Alpharetta, GA: 163.4 |
| 4. San Antonio, TX: 11.3 | 4. Catalina Foothills, AZ: 156.4 |
| 5. El Paso, TX: 13.2 | 5. Parsippany-TH, NJ: 131.5 |
Reviews per Business Listing
A different take on review counts by city… Here we show which businesses are more or less prone to receiving reviews on Google.
- Smaller Cities
- Larger Cities
WANT MORE 5-STAR GOOGLE REVIEWS?
Give your Google rating and reviews a boost! Either see how RevenueJump can help, or download your copy of the free Google Review Generator today.