RevenueJump Local Search Analysis™ 2015
UPDATE: Click to view the newer Local Search Analysis for 2017.
Categories
Cities
Listings
Reviews
Did I really analyze 22,032 local listings?
Yes.
Brodie Tyler here. Prior to investing in the latest version of our RevenueJump web application, I needed to make sure it was a risk worth taking. This research, ultimately known as the RevenueJump Local Search Analysis™, gave me that insight and opened my eyes to how valuable Google reviews are to a location’s ranking.
The 1 Result that Mattered
In case you were wondering… Yes, I was able to justify my investment into the latest version of Revenue Jump. You should try it!
Ultimately, it’s because of a single result.
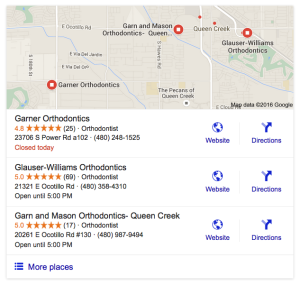
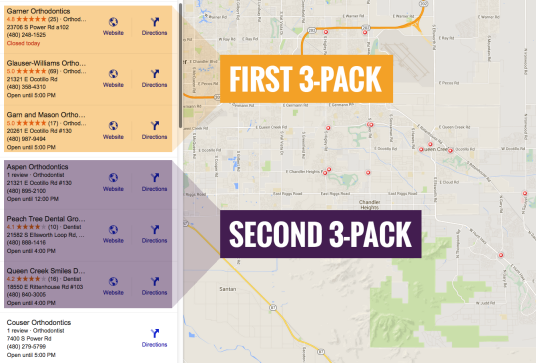
The first 3 Google local results have
472%
more reviews than the second 3 results.
My Methodology
 The platform I chose to analyze was Google, as it is the most widely used search engine.
Over time, Google moved from a 10-pack of local search results, to a 7-pack, to just a 3-pack in August of 2015.
With the opportunity to show up on Google’s first page of local search results cut by over two-thirds, being in the top three results has become even more important for local businesses.

The research wasn’t complicated. In the 4th quarter of 2015 I basically went from search-result-page to search-result-page, counting the number of reviews in the first and second 3-packs of local listings. With the help of my two oldest sons, we recorded these numbers into a spreadsheet that ultimately seemed never ending.
In all, I covered 107 U.S. cities and 29 unique categories of keywords. I looked at 22,032 local listings and counted a total of 101,741 reviews. Below is the data I ended up with.
Enjoy!
Brodie Tyler
Review Distribution
There are 4.72 reviews in the first 3-pack for every 1 review in the second 3-pack.
3-Pack w/Most Reviews
The first 3-pack had more reviews than the second 3-pack 66% of the time.
Listing w/Most Reviews
63% of the time, the local listing with the most reviews appeared in the first 3-pack.
Ratio by Category
The chart above shows the total number of reviews showing up in the first 3-pack for every review in the second 3-pack. The data is displayed on a category-by-category basis. The highest ratio was Pest Control at 12.8 with Restaurants coming in at just 1.7 reviews.
The Most and Least
Cities
A total of 107 cities were included in the study. Below is a table of the three most and least reviewed cities. The number shown is the quantity of reviews per 1,000 of the city’s population.
| Most Reviewed | Least Reviewed |
| Alpharetta, GA: 51.5 | Los Angeles, CA: 1.2 |
| Orem, UT: 49.1 | San Jose, CA: 2.1 |
| Catalina Foothills, AZ: 48.7 | Philadelphia, PA: 2.3 |
Categories
Naturally, the popularity of the 29 different categories is going to vary widely. Here are the three most and least reviewed categories from a quantity standpoint.
| Most Reviewed | Least Reviewed |
| Restaurants: 24,528 | Accounting: 313 |
| Dentistry: 11,755 | Physical Therapy: 497 |
| Auto Repair: 5,300 | Landscaping: 552 |
Category Review Quantity
In all, my research encompassed 101,741 reviews. This chart shows how they are distributed throughout each category. Notice how nearly 1/4th of all the reviews came in from the Restaurants category.
